See how your assumptions and decisions affect revenue, costs and profit, before you commit.

.svg)
.svg)
.png)
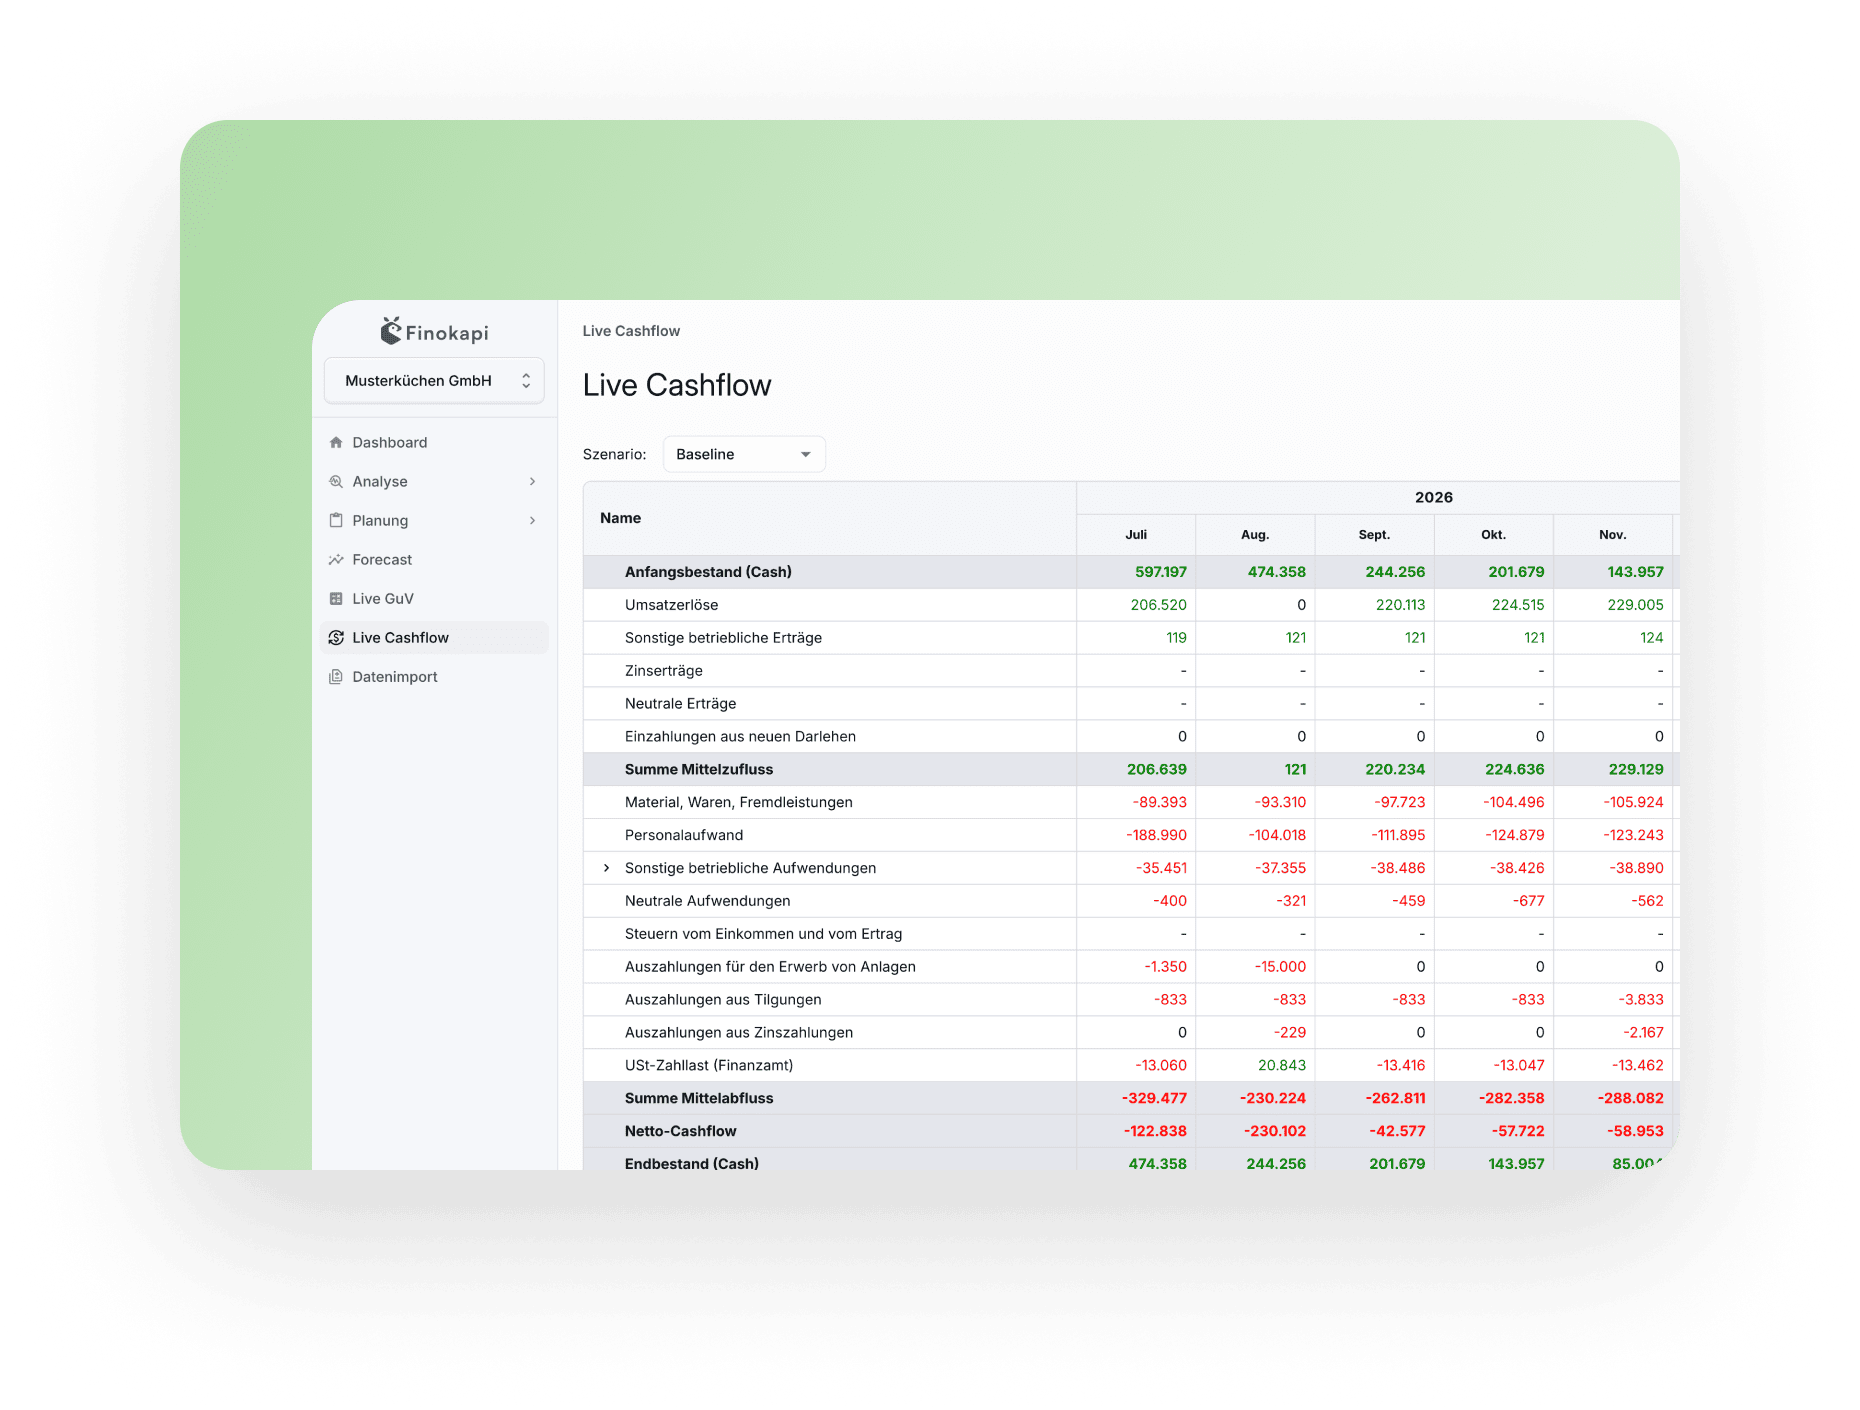
Keep your plan aligned with your latest actuals and roll the forecast forward month by month. You'll know early on whether the business is still heading where you expected.
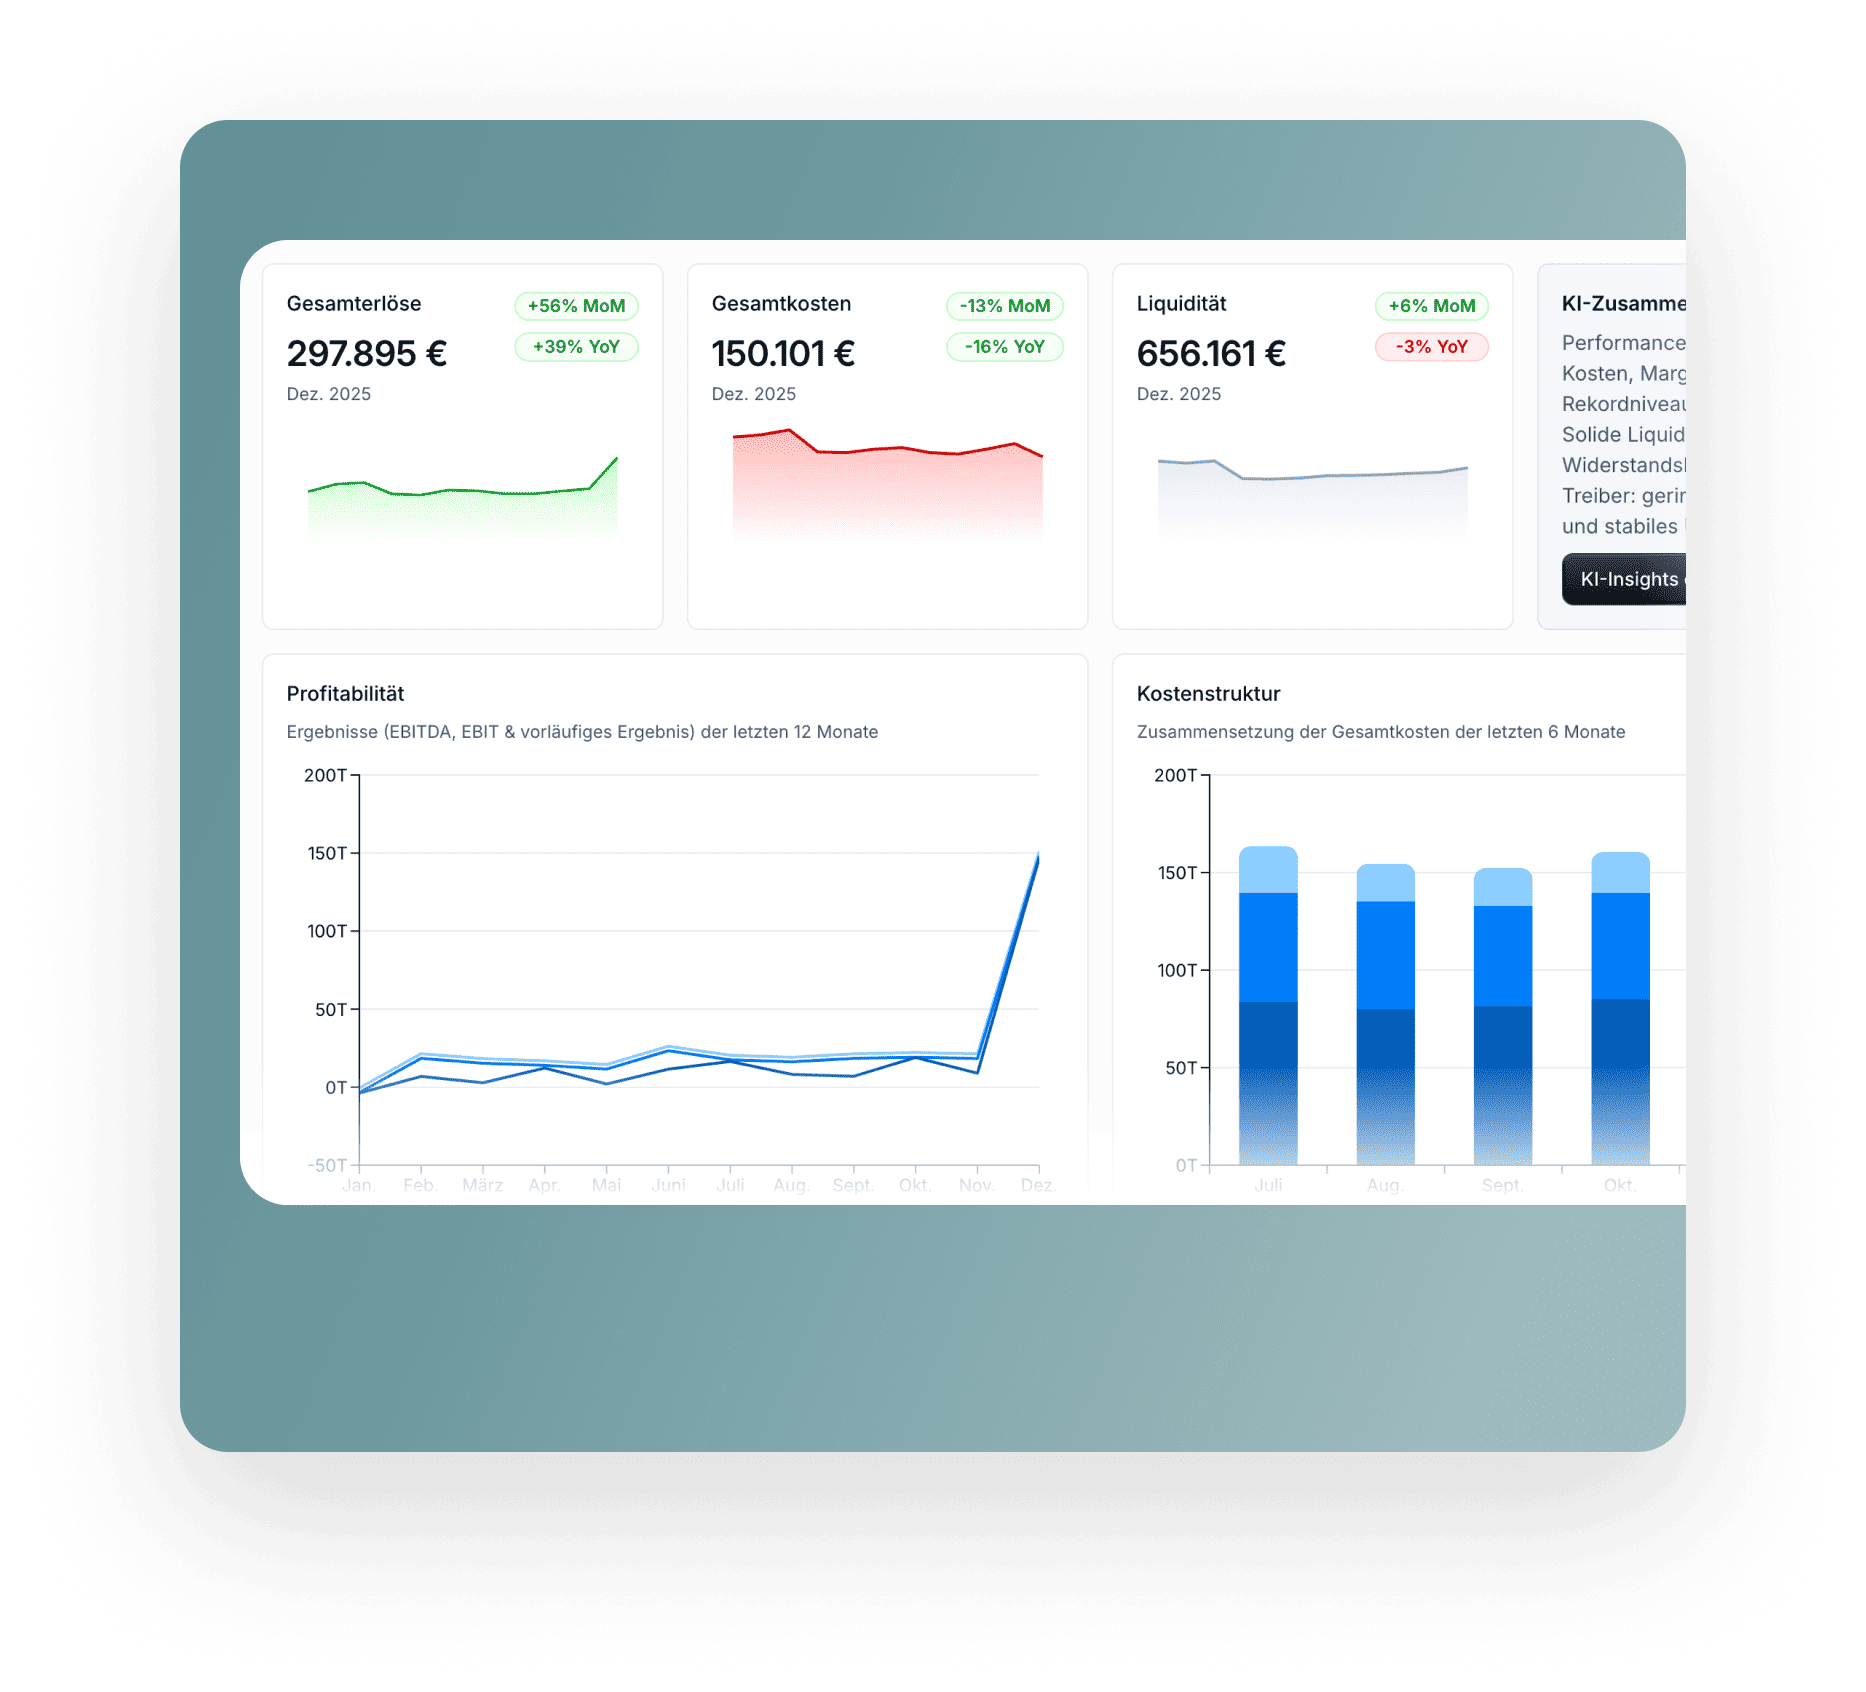
Compare plan and actuals down to line item and G/L account level. So you see early where attention is needed and can course-correct.
Map out different paths in one model and see what a change in assumptions does to your plan. So you make decisions on solid ground.
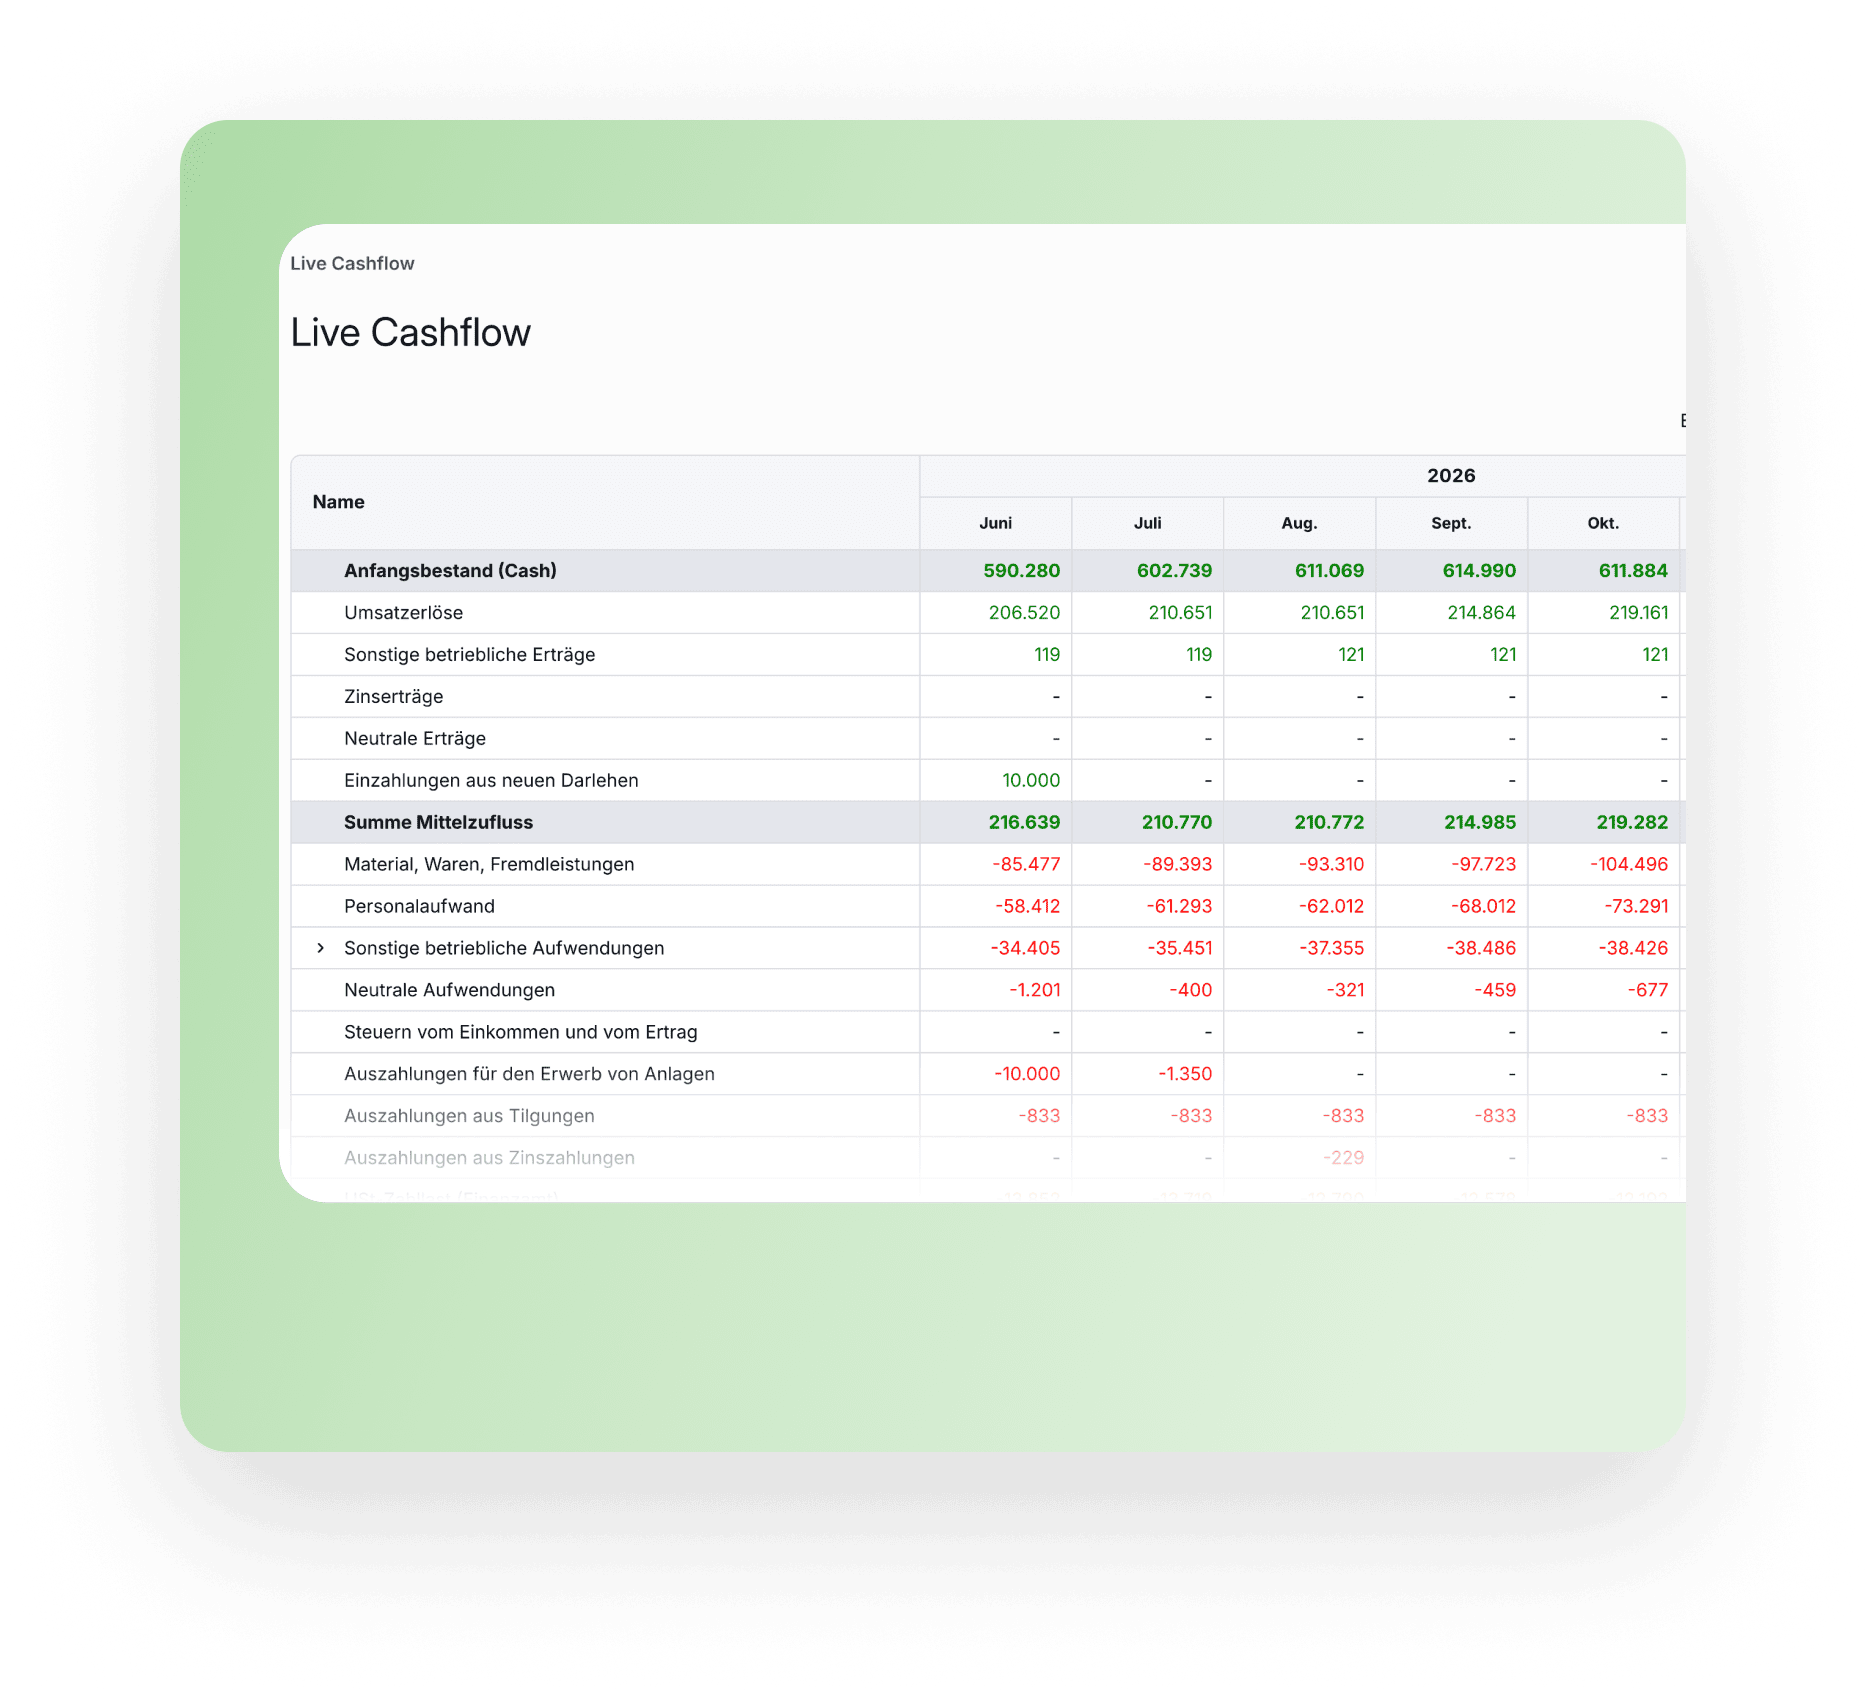
Plan salaries and one-off payments, investments including depreciation, and loans directly in your model. Their impact feeds into your plan, without separate Excel files.
Plan top-down or bottom-up with flexible formulas. Every calculation stays visible, and comments let you document the thinking behind it. You can apply formulas to actuals too, for example to derive plan values directly from past performance.
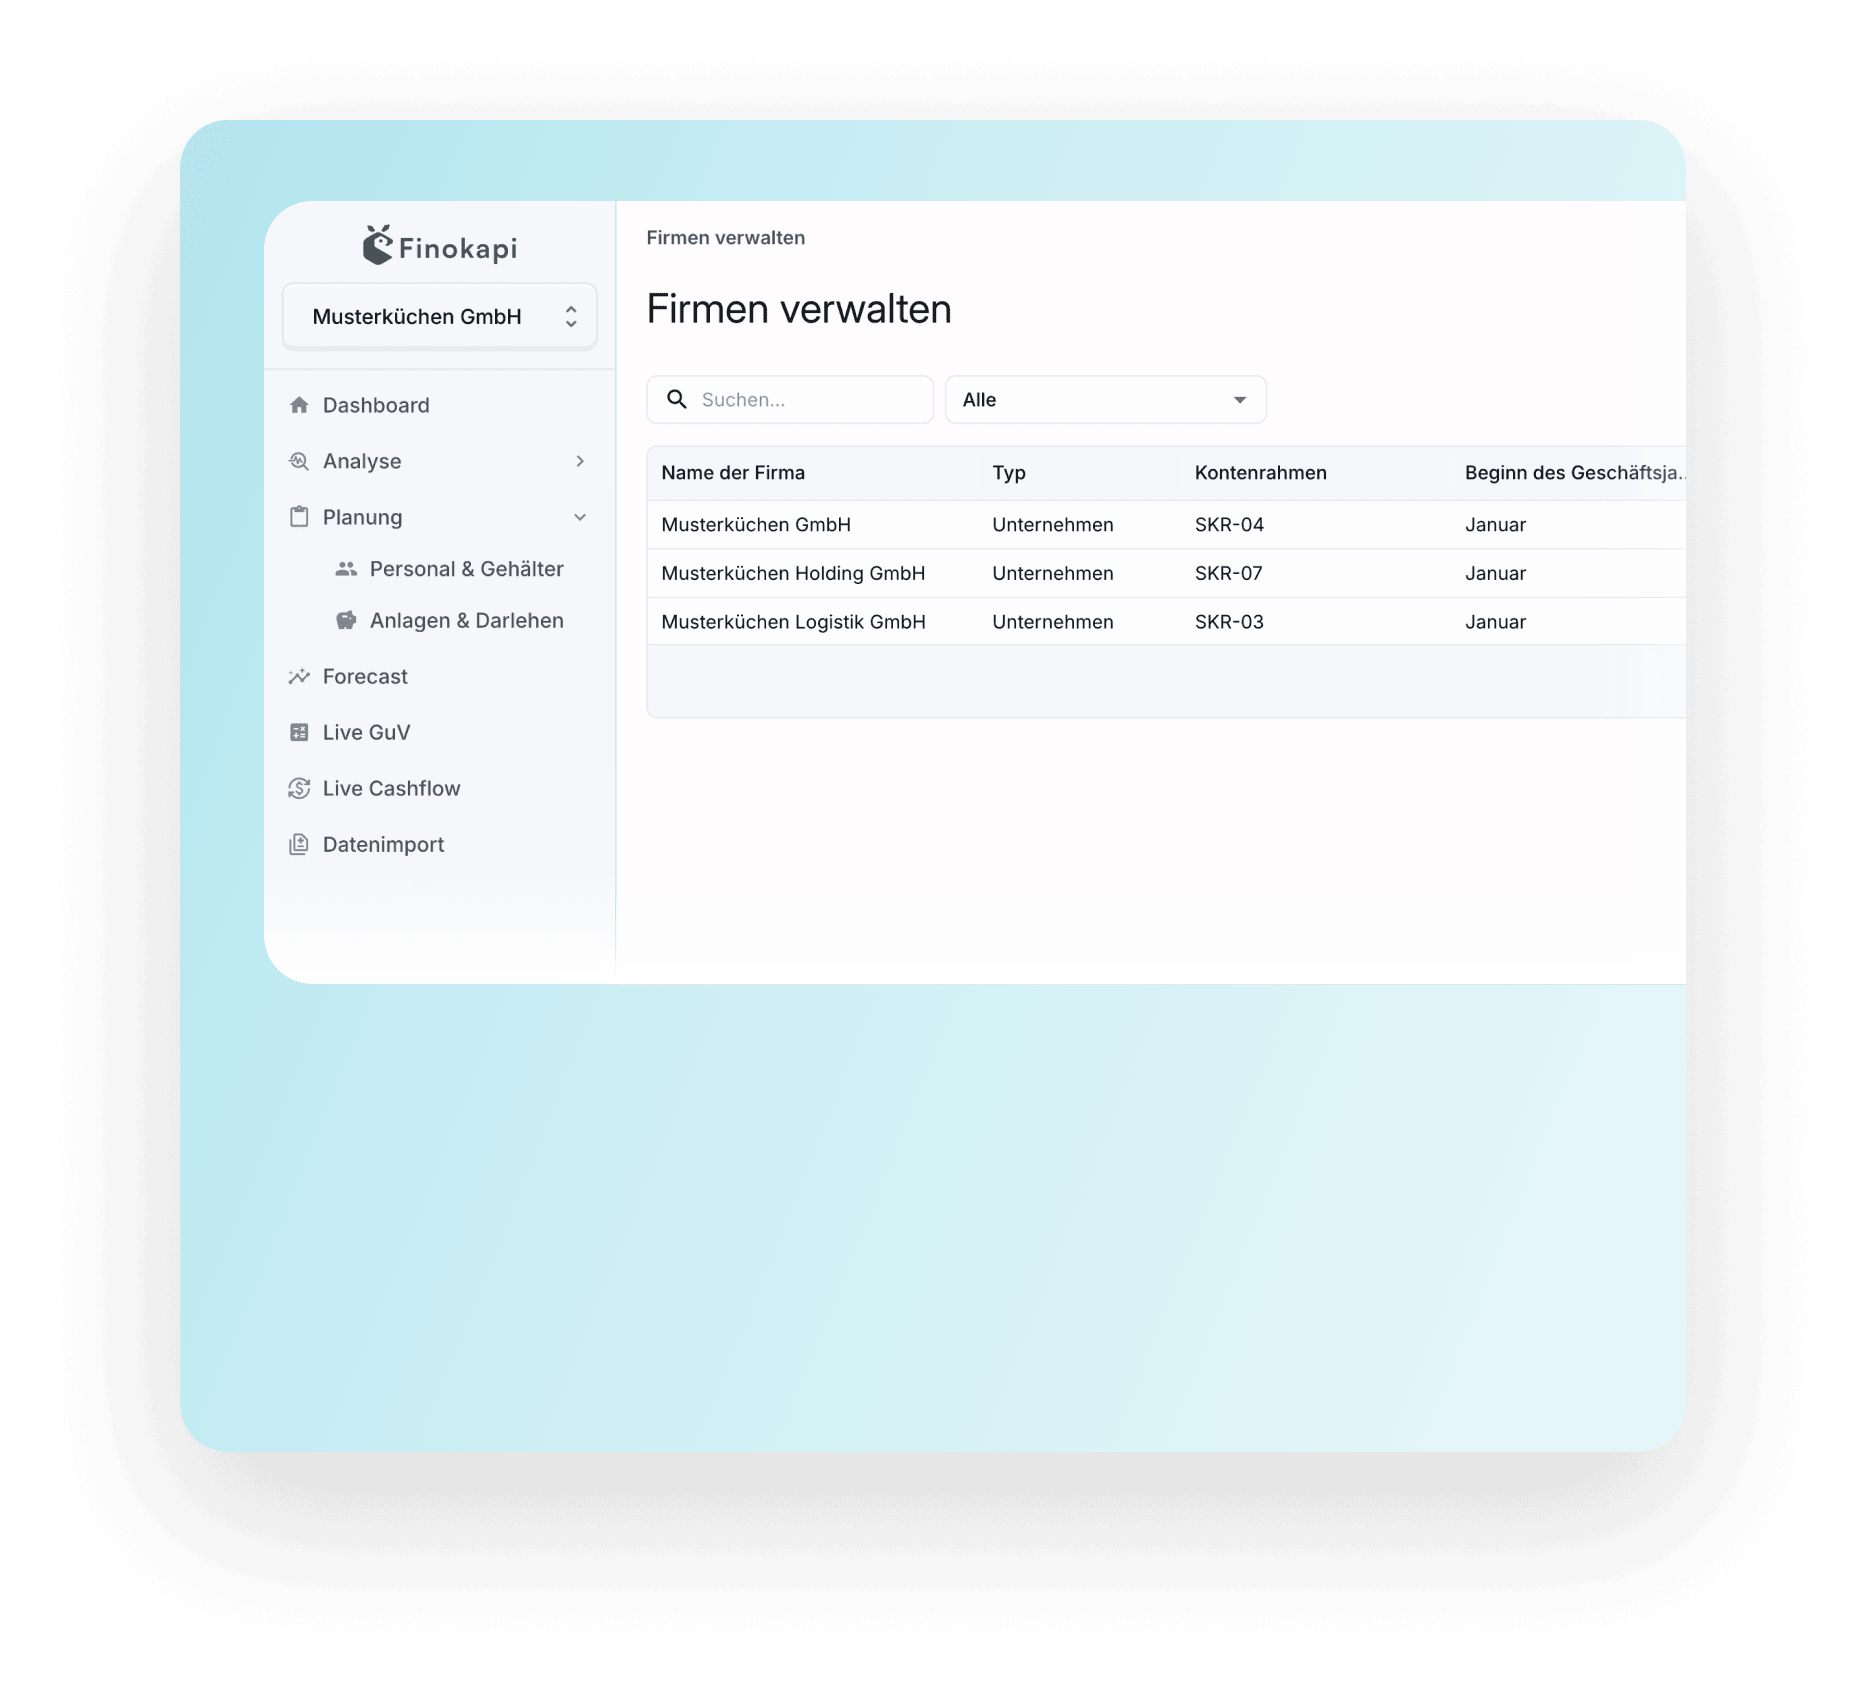
Set up a separate budget plan for each department and bring the sub-plans together into one overall plan. Plan vs. actuals then works for the overall plan and for every single budget.

The rolling planning is a real game changer; I haven't seen it done like this in any other FP&A tool. The forecast gets better month by month, because you keep refining it instead of stopping at a one-off plan. And I get a clear view of my numbers much faster, without all the manual Excel work.

.png)
Try Finokapi free for 14 days.
No. You set your own assumptions and plan values. Finokapi gives you the structure and the planning features to do it. From there, you keep your plan aligned with your actuals and carry it forward as a rolling forecast.
Yes. You build your plan with formulas, top-down or bottom-up, and you can apply them to actuals too. The logic behind every calculation stays visible instead of disappearing into individual cells. That makes assumptions and calculations far easier to follow than in a complex Excel file.
A rolling forecast is updated regularly and rolls forward as new periods are added. New actuals replace the plan values of closed months. You keep looking ahead without rebuilding your plan from scratch every year.
Yes. You can map out different scenarios in one model and compare how different assumptions affect your plan and expected profit.
Yes. Salaries and one-off payments, investments including depreciation, and loans all sit directly in your model. Finokapi calculates their impact on your plan automatically.
Finokapi puts your plan values next to your current actuals, down to line item and G/L account level. You see variances where they arise, not just in the totals.
For example, payroll costs come in twelve per cent over plan in March. You open the line and see that a bonus was posted a month earlier than planned.
Yes. You set up a separate budget plan for each department, for example sales, marketing or a cost centre. Finokapi brings the sub-plans together into one overall plan. In the plan vs. actuals comparison you then see, for the overall plan and for every single budget, where the actuals deviate from the plan.