

P&L, balance sheet, cash flow and KPIs, straight from your accounting data. Plus an AI management report that shows you what changed and why.


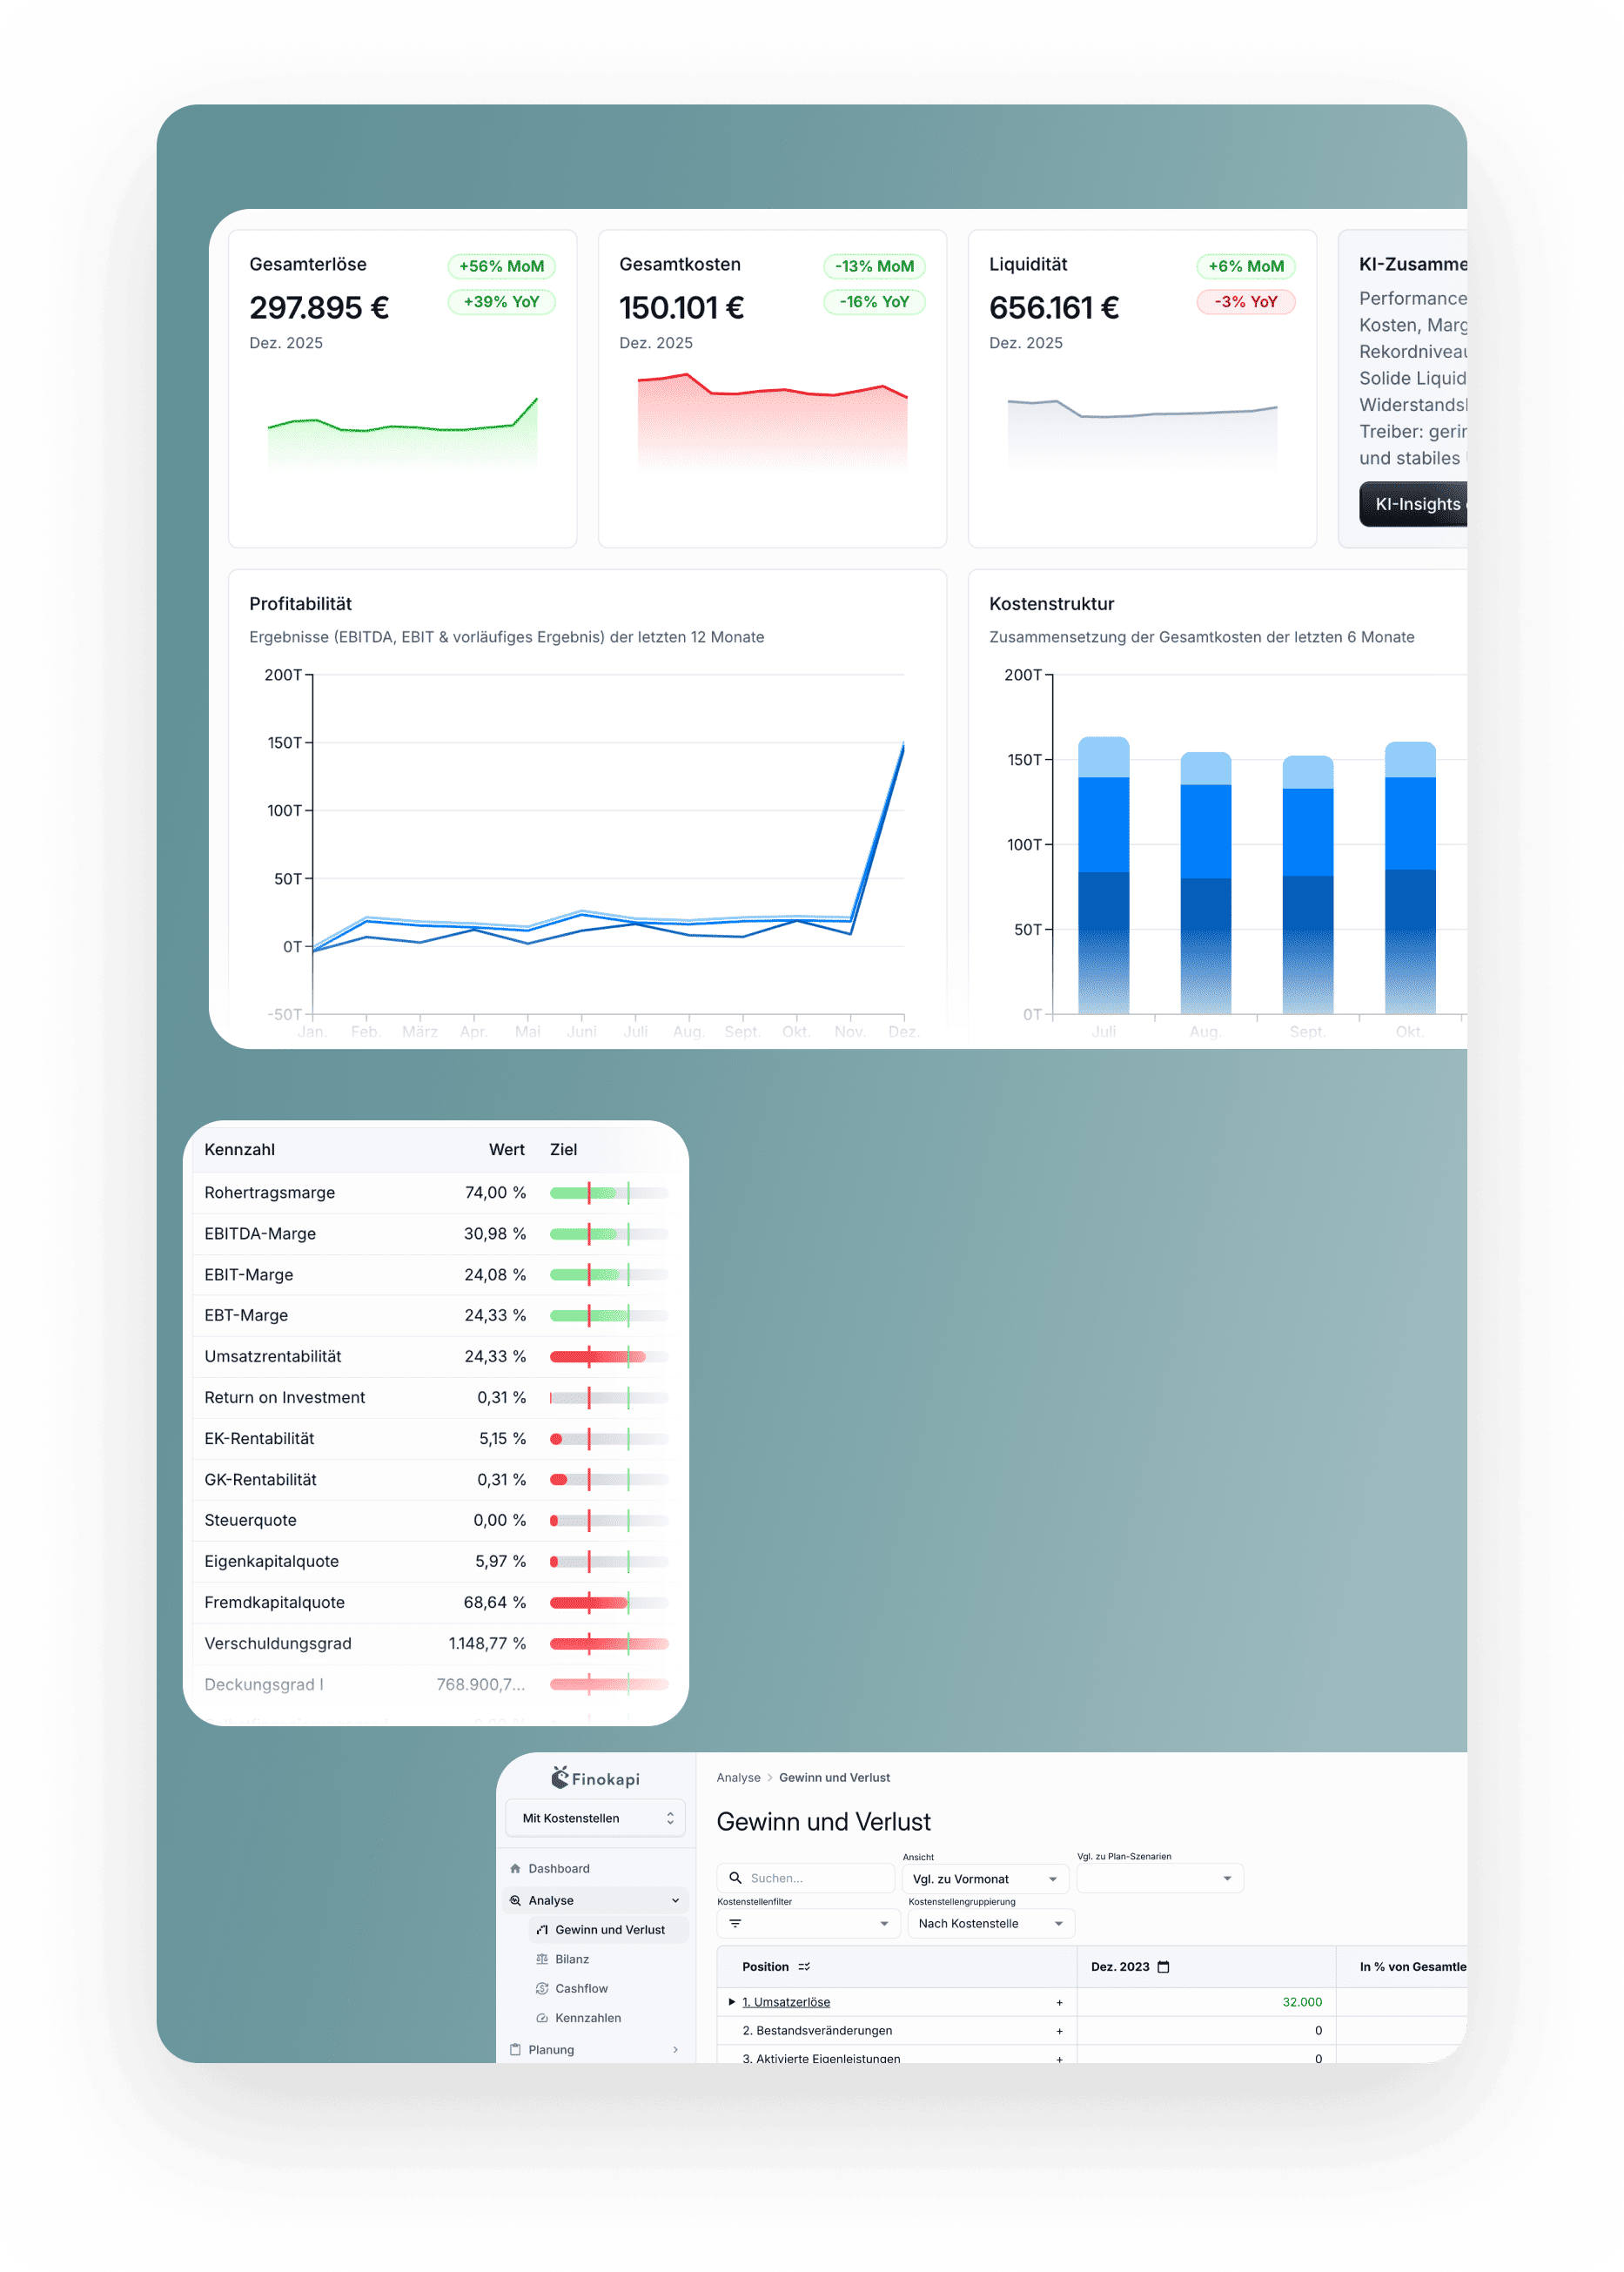
Your financial reports are built straight from your accounting data. New transactions flow in automatically with the next sync.
Automatically calculated KPIs show you how revenue, costs and margins are trending. So you spot changes early and react faster.
Open any line in your P&L down to G/L account and cost centre level and see what makes up the number. So you get to the bottom of a variance fast.
The AI management report summarises your numbers across six areas of analysis in plain language. It flags unusual accounts and separates year-end effects from genuine operating changes.

The AI management report already analyses my numbers and surfaces early warning signals, which simply saves time in reporting. For me, Finokapi is also a good way to use AI on financial data without dumping my numbers straight into an AI chat.

.png)
Start your free trial
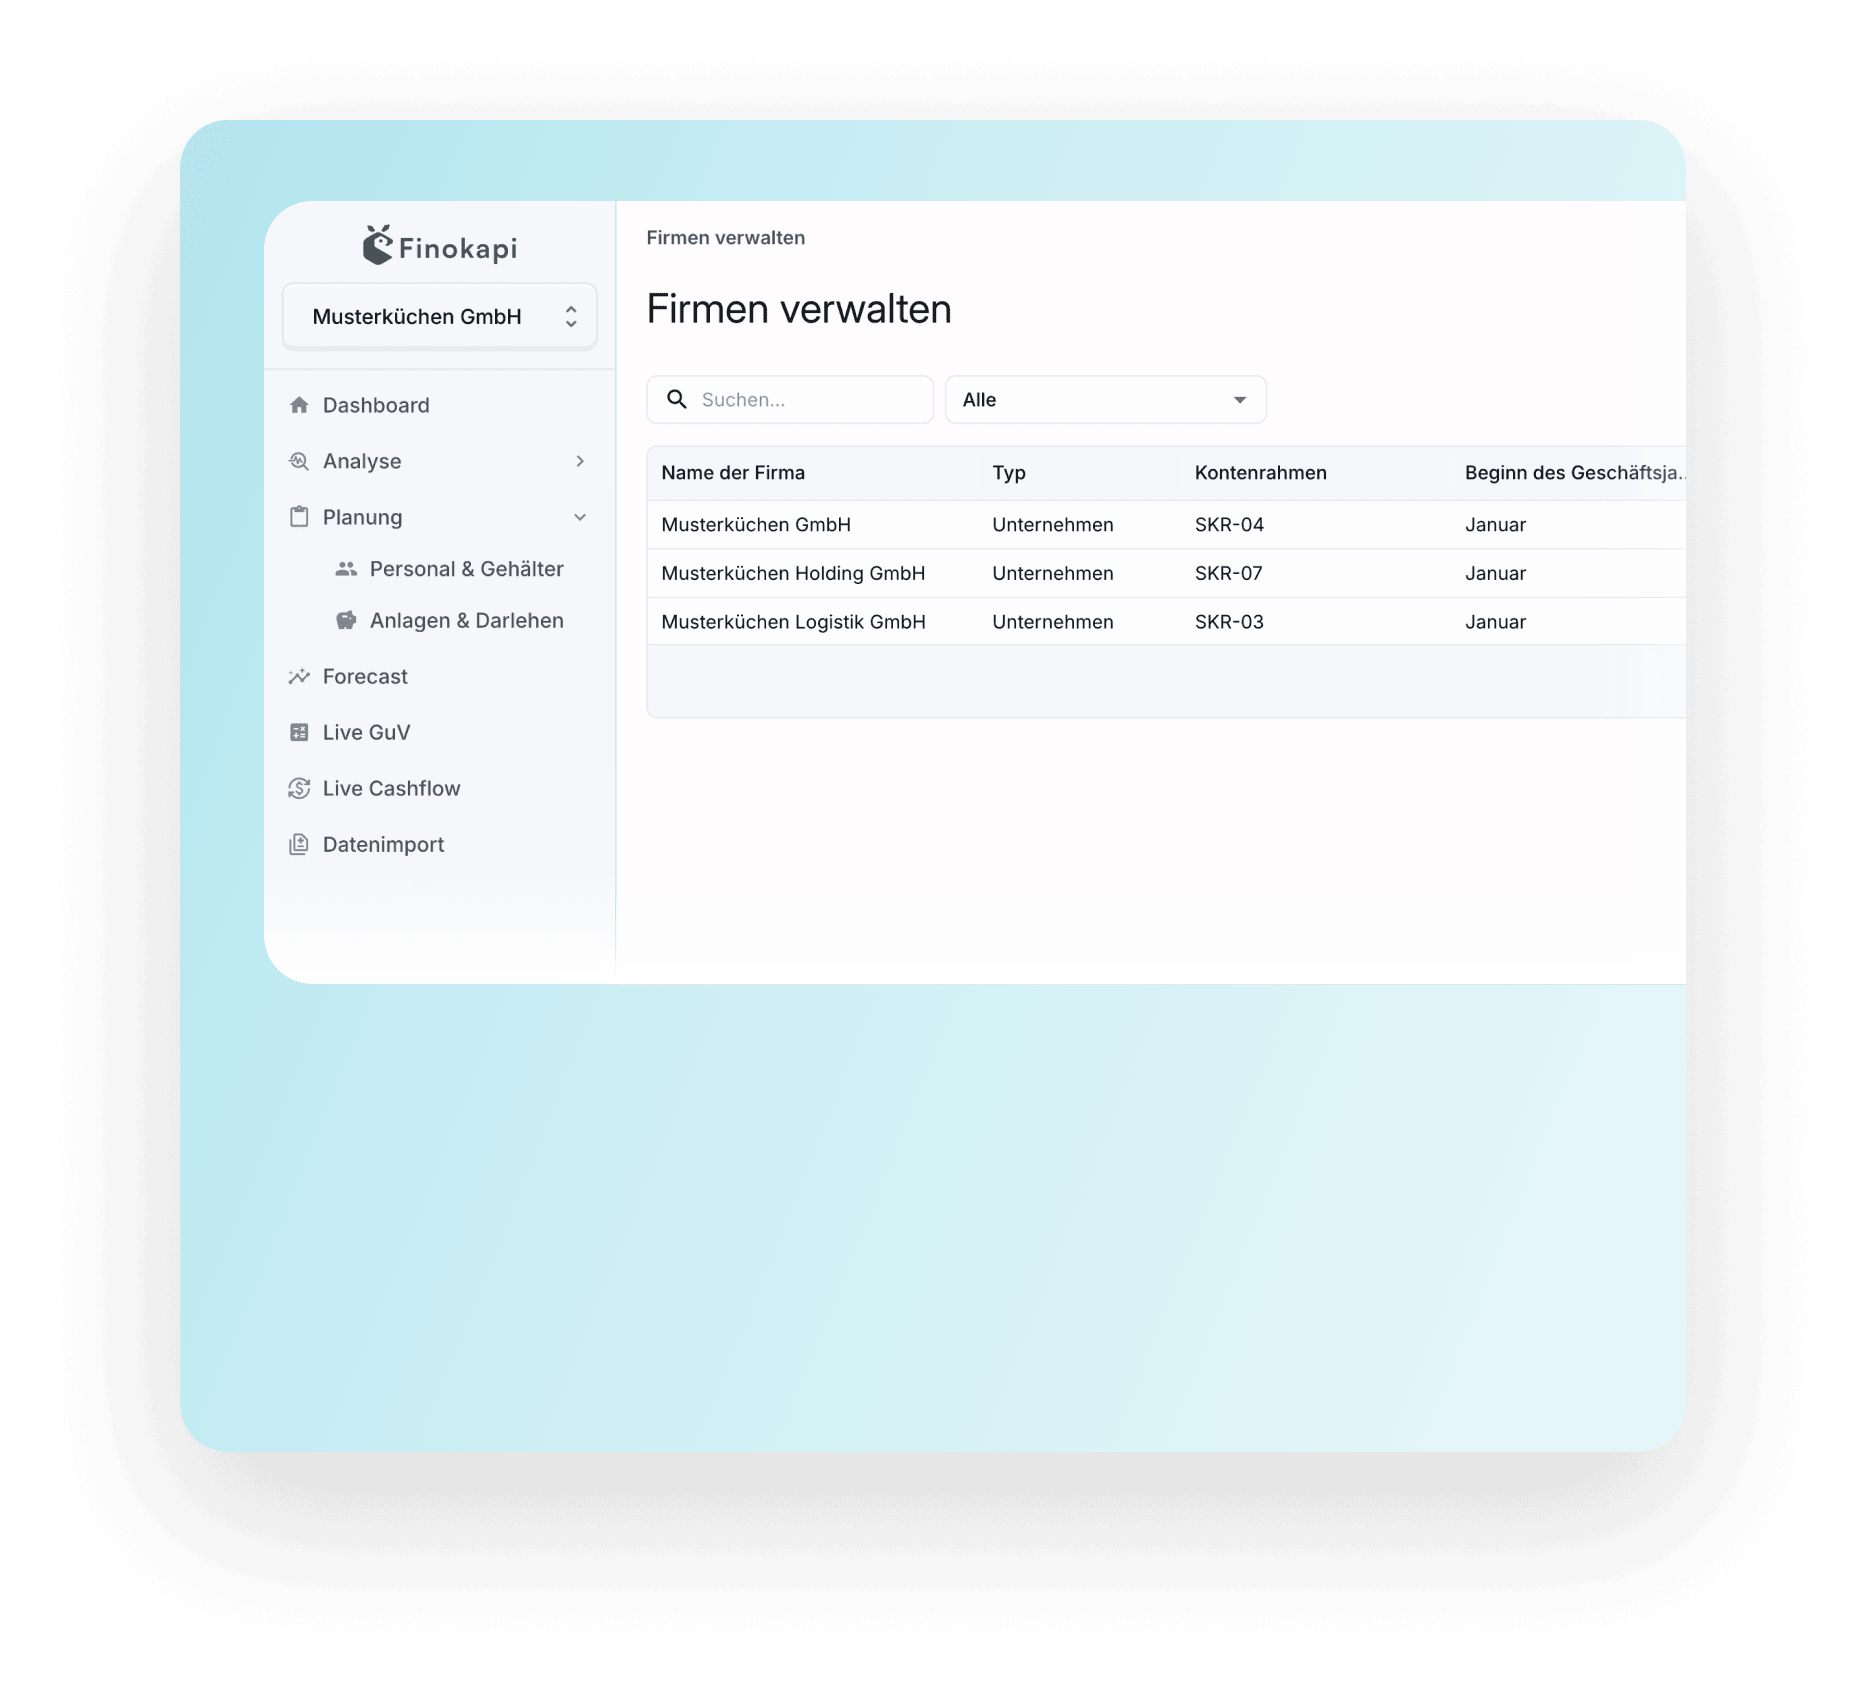
Finokapi connects to your accounting system and pulls in your posted transactions. With DATEV this runs live via API in one click. Other systems like Lexware, sevDesk or Agenda connect via CSV import. From this data, your P&L, balance sheet, cash flow and KPIs are generated automatically. Which systems are supported and how the connection works is on the Integrations page.
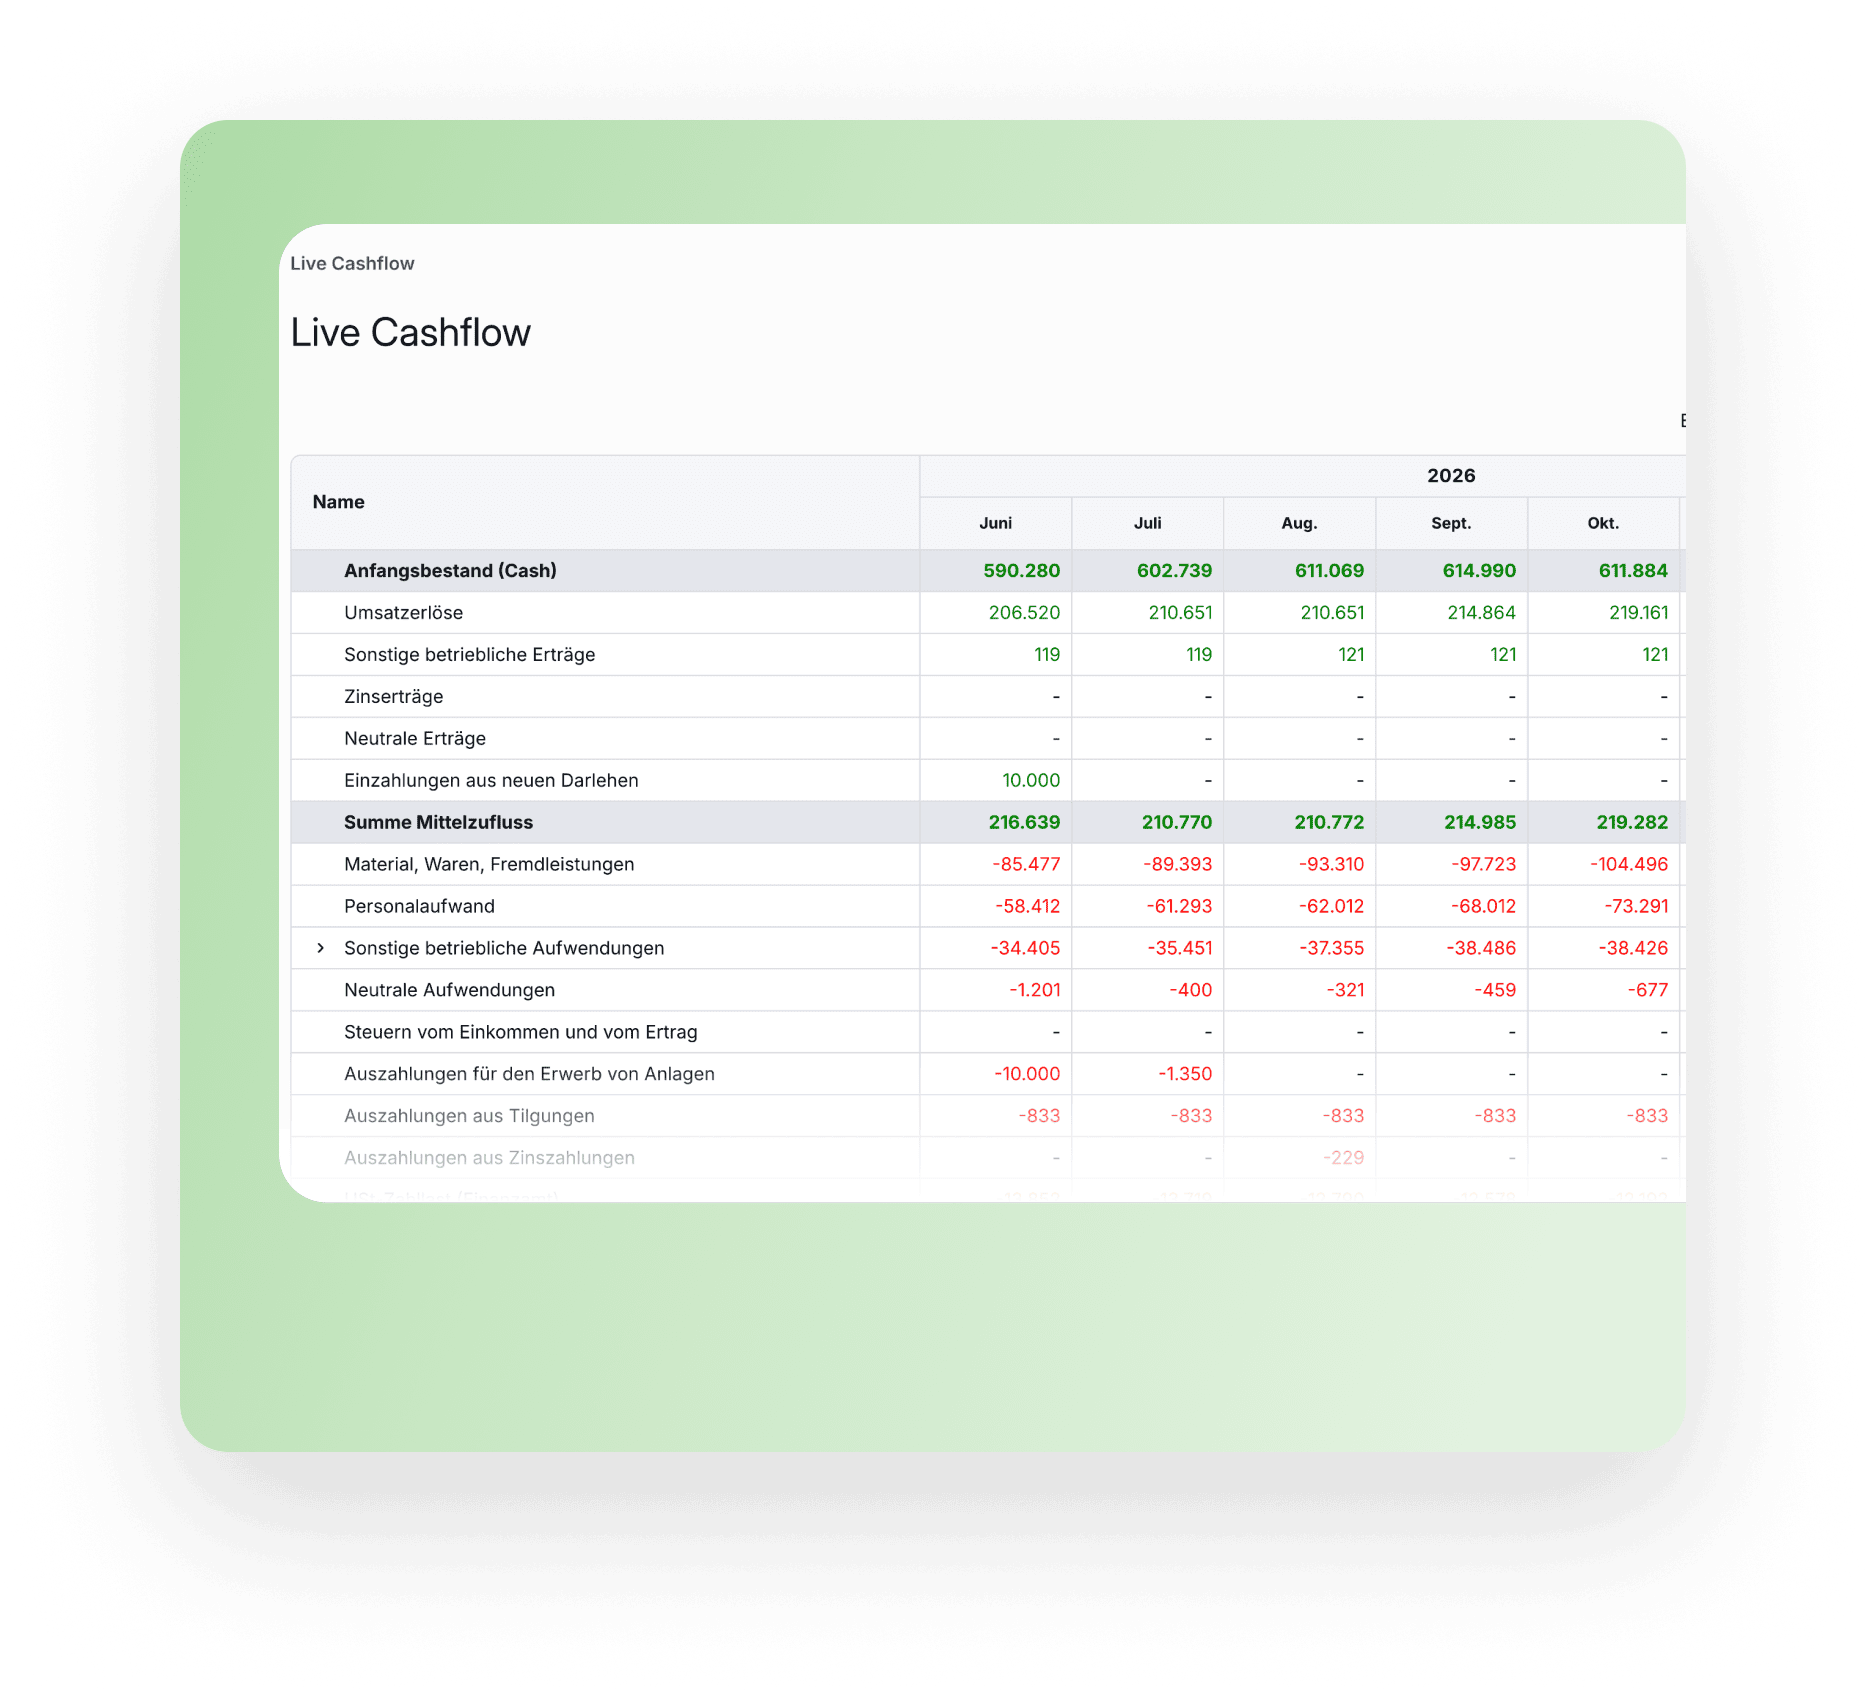
Your reports show the state of your most recently synced accounting data. As soon as new transactions come in, your P&L, balance sheet, cash flow and KPIs update automatically, without you rebuilding anything in Excel.
The P&L from your accounting system shows you the numbers, but it's often rigid and hard to read. In Finokapi you adjust the structure, drill down to G/L account and cost centre level, and see trends and variances visually. The AI management report then summarises your numbers in plain language and flags anomalies automatically. A plain table of numbers becomes something you can actually base decisions on.
Yes. You adapt the P&L structure to your company, define your own KPIs, and build dashboards the way your team needs them.
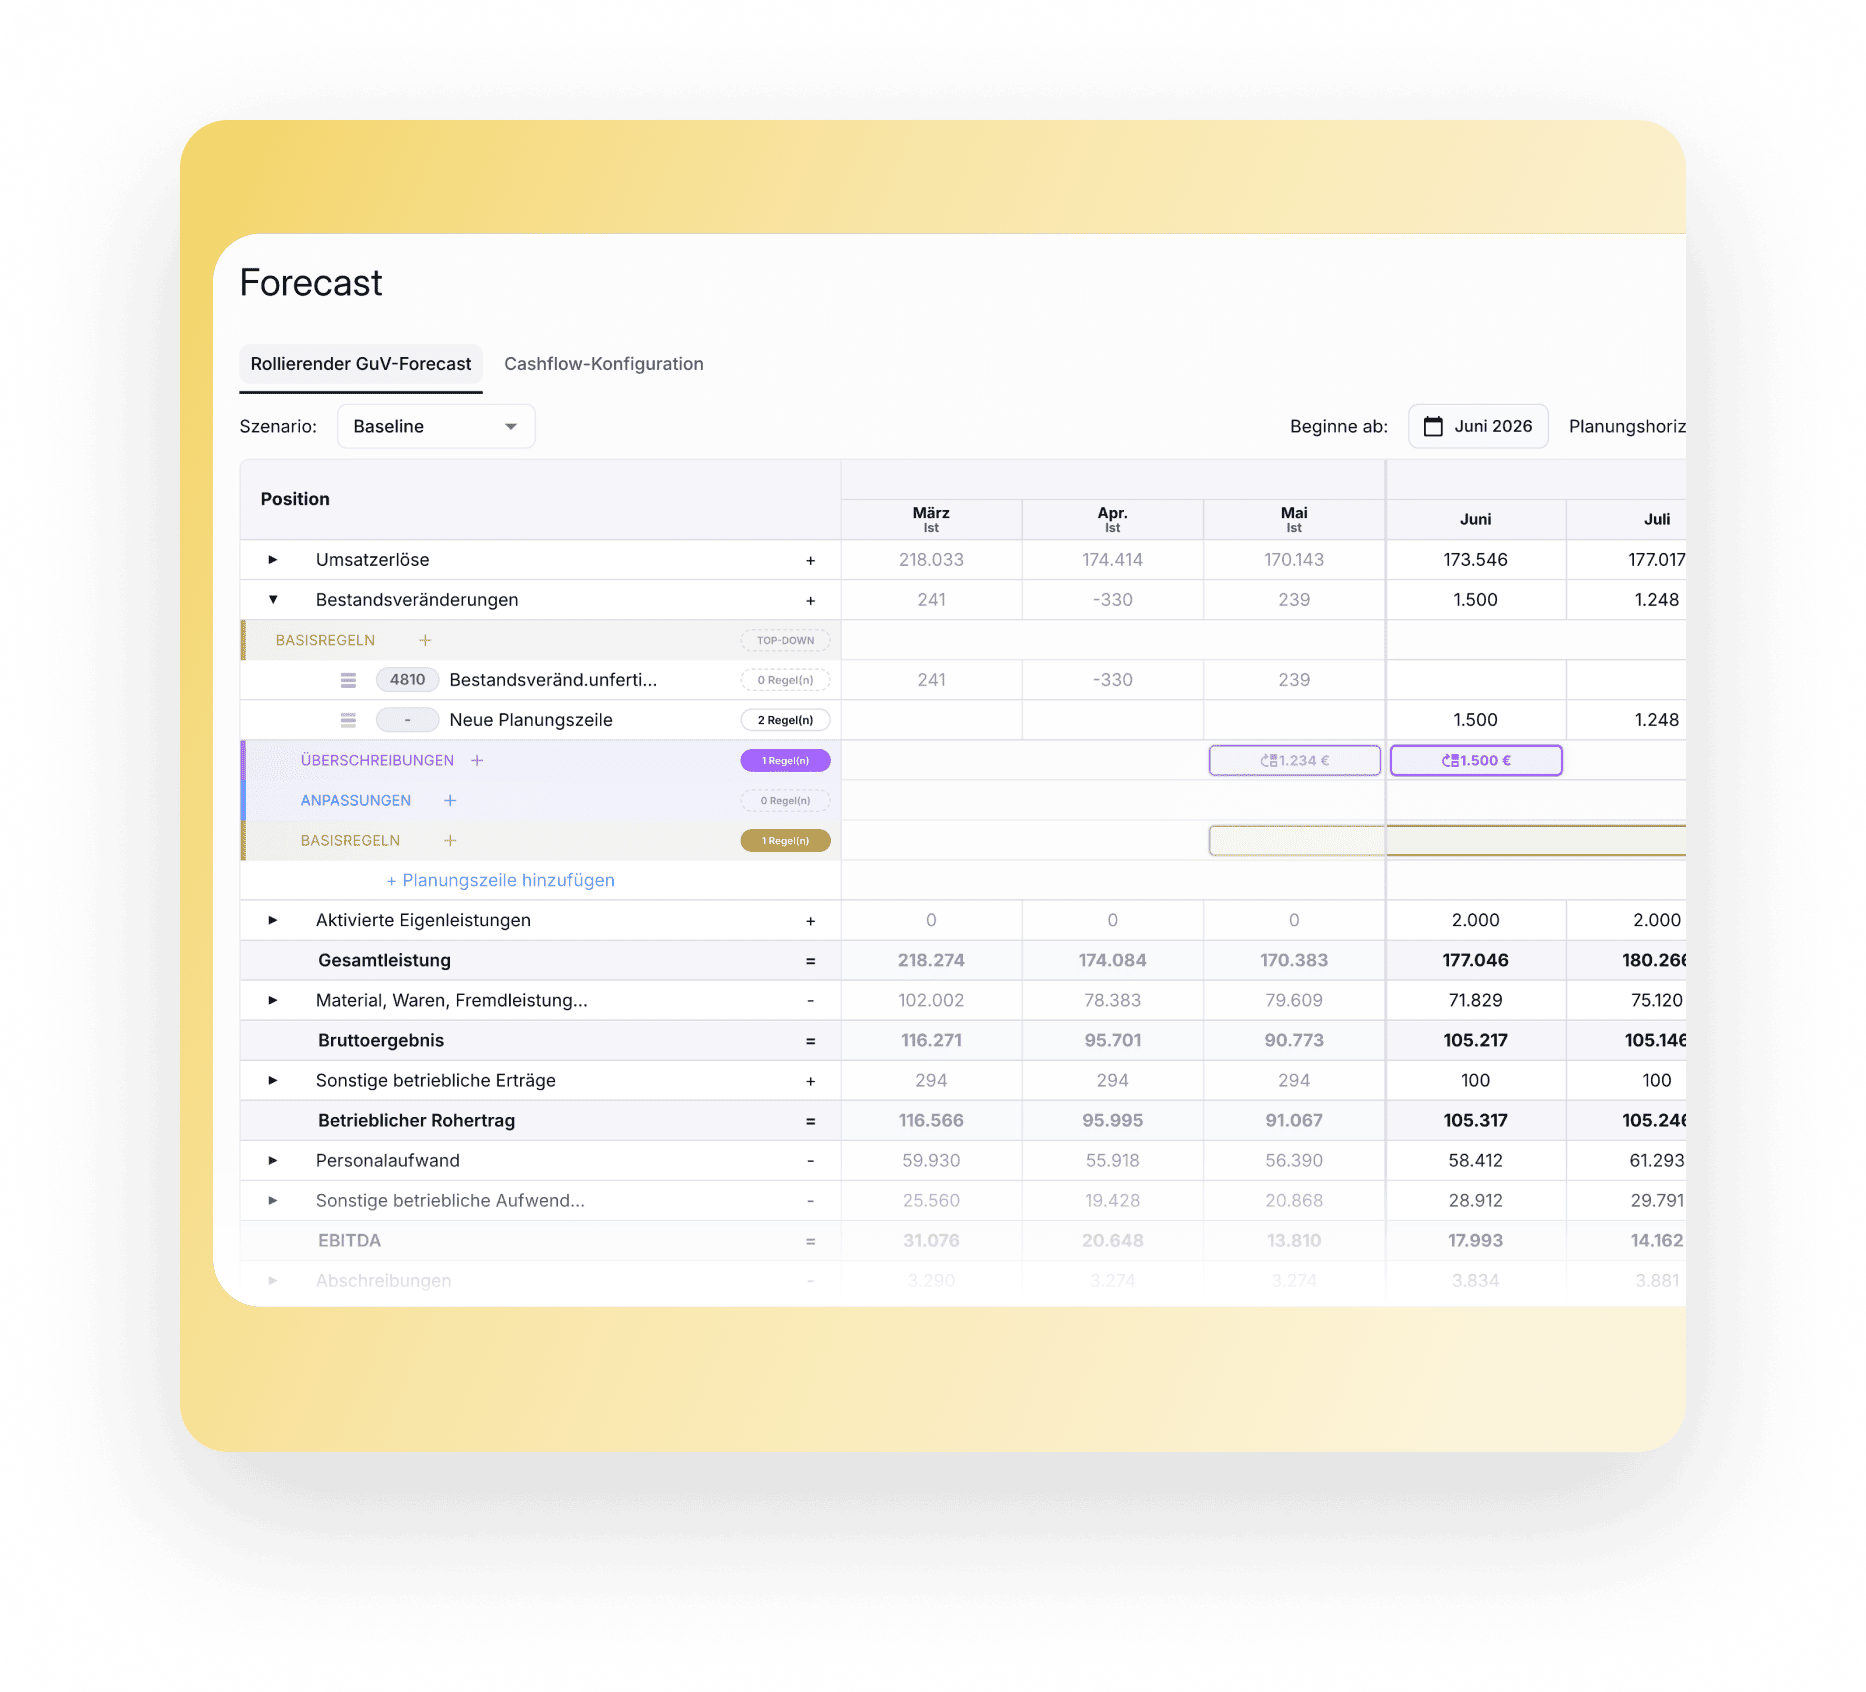
The AI management report summarises your already-prepared numbers in plain language, across six areas of analysis from profitability to capital structure, and flags unusual accounts automatically. Your planning is still yours to build, with the structures Finokapi gives you.
No. Finokapi runs in your browser, there's nothing to install. With DATEV you connect your data in one click; other systems run on a CSV import. After that, your reports are ready.
The quickest way to a useful answer is to start with the trend rather than a single month. In Finokapi you compare revenue, costs and margins across several periods and see straight away which lines in your P&L have moved. Those are the lines you open, drilling down to G/L account and cost centre level until you find the cause. The AI management report takes that first step for you and names the most significant changes on its own.
Yes. Finokapi runs on servers in the EU, is GDPR-compliant, and encrypts your data in transit and at rest. Hosting is in ISO 27001-certified data centres.


.png)